The Data Blog

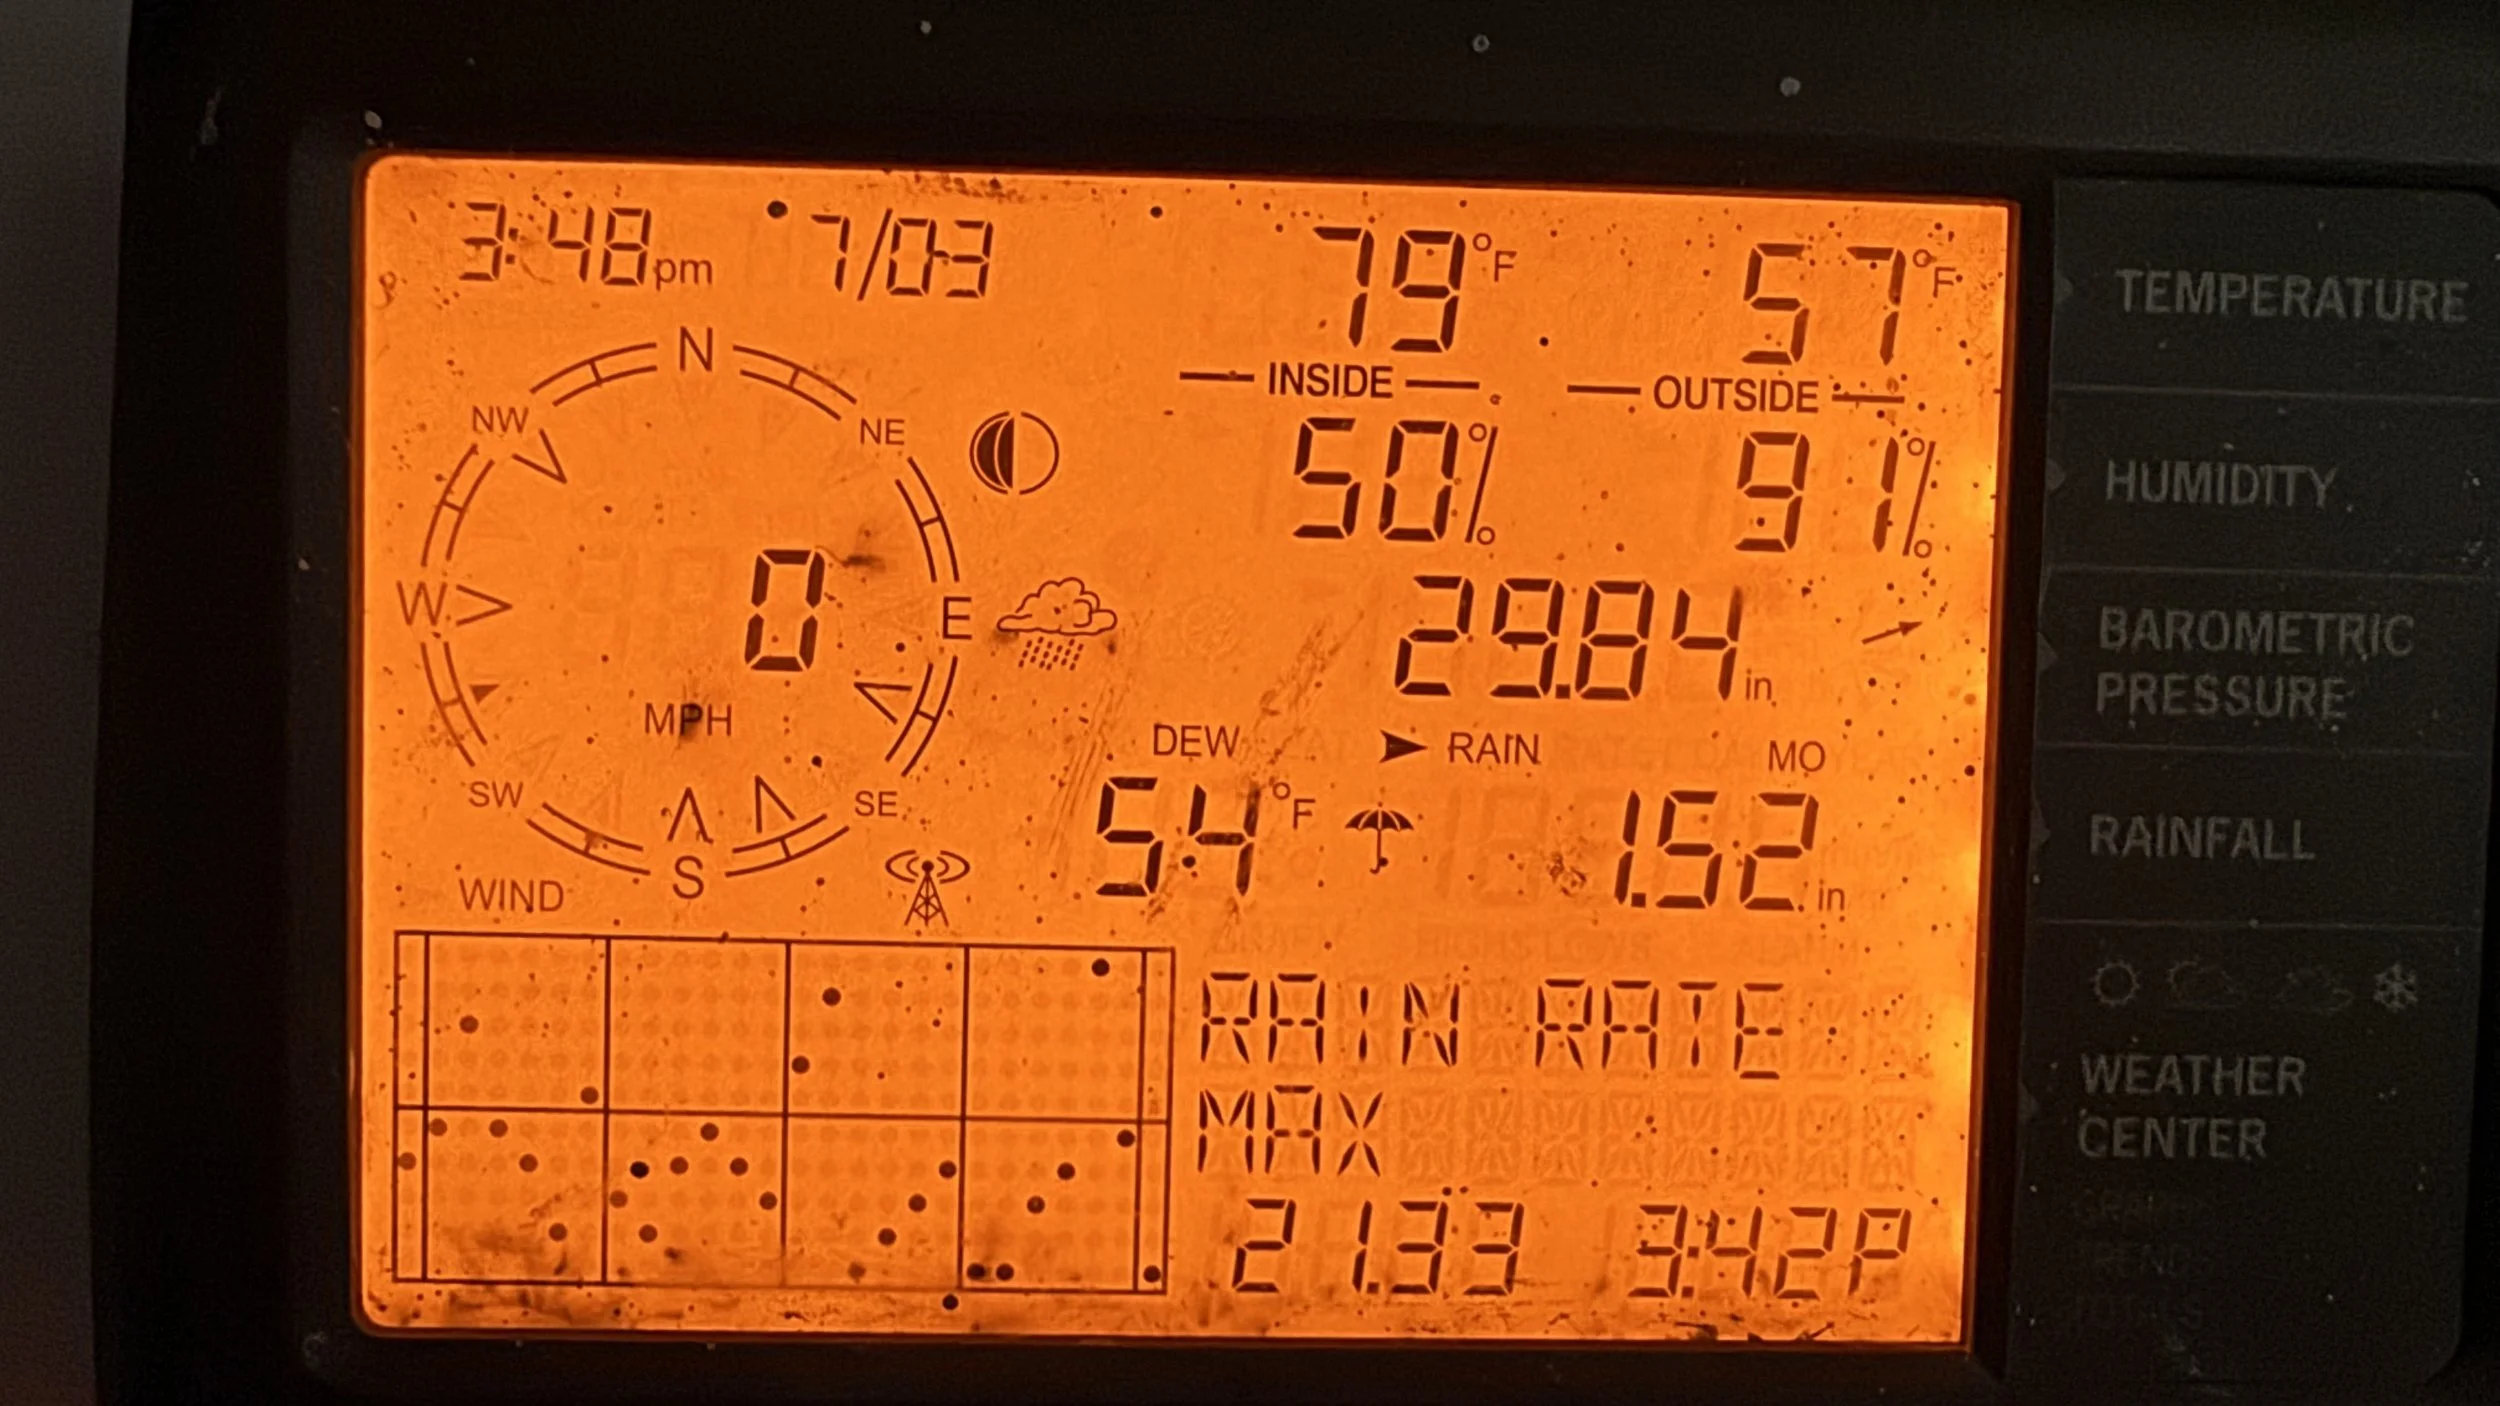
Since I first moved to the studio in May of 2014 I’ve been capturing data about my experience here… Photos, weather, solar and now bird calls, this blog now that I have over 10 years of data start to explore what we can see & learn form this. Enjoy.


Last updated may 13, 2025

July 3rd, 2025 micro burst.

Brief but powerful storm rolled through the area on July 3rd and did tremendous damage to trees and some property and knocked out power to over 5000 people for days. Here’s the data I collected. Note a mix of still drone footage & weather station data (thank goodness I splurged for the nano SD upgrade just a month ago). Since this is the ‘data” blog for the studio I’ll lead with charts:

Super interesting, you can obviously tell when the storm hit, but there doesn’t seem to be a huge barometric change, and both the wind and rain readings aren’t that high despite their spikes. I wonder if it’s particular to this storm (WNEP video linked at the end for more detail).

Full flicker album of my photos and videos here:

Drone video of some of the damage:

WNEP 16 video about the storm:

Finally an image of my weather station (vanatage vue) peak rainfall measurement, 21.33” PER HOUR! Most it’s ever recorded (May 13, 2014 to now)

Birds & Weather (Copy)

May 2024 - May 2025 KPPSTARR2 weather data combined with Starrucca Hikau Box bird call data

Bird Weather Viewer v02.1 — Staggered Solar/Rain

BIRD CALLS, WEATHER & SOLAR — V02.1

DAILY BIRD CALL TOTALS

Daily bird calls over time. compare up to three species at a time.

Haikubox Bird Call Viewer

Daily Bird Call Totals

Studio Weather data

Weather data from 2015 to present, you per date (is it hotter, cooler or Rainer than years past?

Loading...

Solar Data

📈 Solar Year-Over-Year Chart

📈 SOLAR YEAR-OVER-YEAR CHART